
DFD Diagram for Loan Management System
The DFD (Data Flow Diagram) for Loan Management System describes the overall “flow” of data on the project. It is used to document the transformation of data (input-output) for project development.
The loan management system DFD consists of DFD levels 0, 1, and 2. It also uses entities, processes, and data to define the whole system.
Table of contents
- DFD Diagram for Loan Management System
- Data Flow Diagram for Loan System: Details
- Definition of Loan Management System
- What is Loan Management System DFD?
- Importance of Data Flow Diagram (DFD)
- Advantages of Data Flow Diagram:
- Loan Management System Data Flow Diagram (DFD)
- Loan Management System Data Flow Diagram Pdf
- Data Flow Diagram Notations:
- How to Create Data Flow Diagram?
- Conclusion
- Related Articles:
- Inquiries
Data Flow Diagram for Loan System: Details
The table shows the overview and details of the data flow diagram (DFD) for loan management system. It has complete information about the project.
| Name: | Loan Management System (DFD) Data Flow Diagram |
| Abstract: | The loan management system data flow diagram (DFD) shows the structure of the project in terms of its data management. It contains the important details on the flow of data and alternatives done in the project. |
| Diagram: | Data Flow Diagram (DFD) |
| Users: | Lending Companies, Admin, Members, and Clients. |
| Tools Used: | You may use any Diagram tools that provide data flow diagram symbols. |
| Designer: | ITSourceCode.com |
Definition of Loan Management System
The entire loan lifecycle is automated via an online loan management system. Lenders use it for the entire lending process or just certain sections of it.
Additionally, the system provides assistance at every level, from processing new customer information to collection management. It automates the entire loan lifecycle, from application to close.
What is Loan Management System DFD?
One of the methods used for loan management system development is the DFD (data flow diagram). It represents the system’s major processes and alternatives that generate the internal flow of data.
Additionally, the data was properly categorized to illustrate the loan management system structure. Take note that DFD is not part of the Loan Management System UML Diagrams, but they complement each other in explaining the project activities, behaviors, interactions, and structure.
Importance of Data Flow Diagram (DFD)
The importance of the data flow diagram (DFD) for loan management system is to show the developers the actual happenings in the system. This is done by visualizing the system’s data management at various levels.
Furthermore, the DFD levels were used to discuss the loan management system data flow. These levels have their part in expounding the system’s data flow structure details. It is then applied in creating Loan Management System ER Diagram.
Data flow diagrams not only describe the flow of data but also denote the steps involved in transferring data from one process to another. As a result, the data was transformed from input to output.
Advantages of Data Flow Diagram:
The Advantages of the Loan Management System Data Flow Diagram are as follows:
- It is a representation that aids in the visualization of system contents.
- Included in the system documentation file.
- Simple to grasp and understood by both programmers and users.
- System components were detailed and explained in DFD diagrams.
- It also aids in comprehending a system’s operation and limitations.
Loan Management System Data Flow Diagram (DFD)
A thorough explanation is provided for the example data flow diagram for loan management system. This example emphasizes the three DFD levels (DFD Levels 0, 1, and 2).
0 Level DFD for Loan Management System
The context diagram is an alternative name for the Level 0 DFD Diagram for Loan Management System. Users, the main process, and data flow make up its parts. Also, the project concept is demonstrated using the single process visualization.
DFD Level 0 shows the entities that interact with a system and defines the border between the system and its environment. This diagram also depicts the loan management system at a high level.
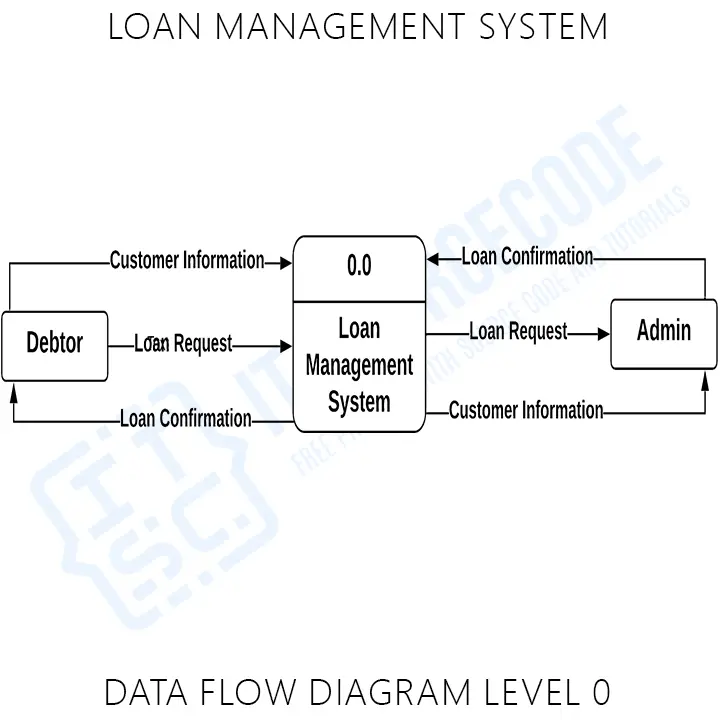
The illustration presents the main process in a single node to introduce the project context. This context explains how the project works in just one look. The user feeds data into the system and then receives the output from it.
In addition to this, you will perceive through the diagram that there is already the presence of data flow. Though the process is very general, the flow of data is clear. Nevertheless, just modify this diagram to meet the other requirements and include other matters regarding loan management.
Level 1 DFD for Loan Management System
The “detonated view” of the context diagram is Loan Management System DFD Level 1. Its function is to deepen the concept derive from the context diagram.
Specifically, level 1 shows the broader details of Loan Management System DFD Level 0. This is to clarify the paths (flow) of data and its transformation from input to output.
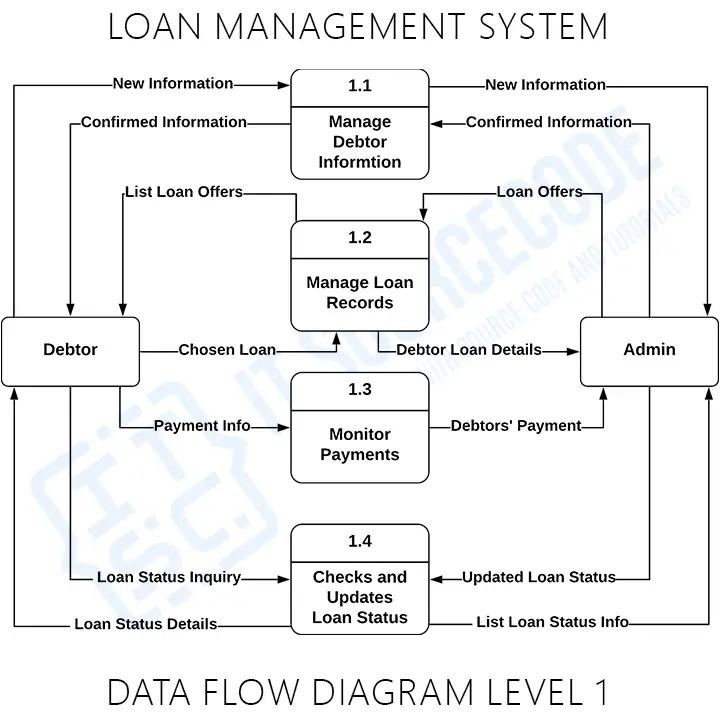
The designed diagram portrays four different scenarios: debtor information management, loan records management, payment monitoring, and checks/update loan status.
Firstly, the flow of data starts from the lender and the debtor. Then the system caters to the transaction. This idea was based on lending processes or transactions.
You can also see the data store used or the database. The database is also used in storing users’ data inputs. Then it serves as the source of outputs.
DFD Level 2 for Loan Management System
Level 2 DFD for Loan Management System is also the highest abstraction of the data flow diagram. This level also broadens the idea from the DFD level 1. It includes the sub-processes from level 1 as well as the data that flows.
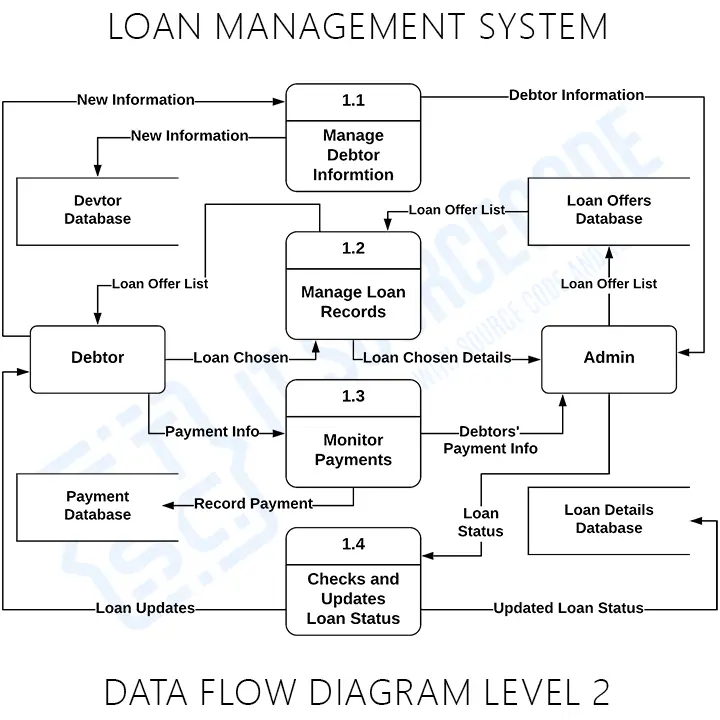
However, not all of the processes in the project must have sub-processes. Only provide this diagram if needed. As long as your previous diagrams were clear and precise, this level is not required.
You can add more to this and it is up to you how will you create your data flow diagram. Also, consider the data flow included and be precise with your information.
Loan Management System Data Flow Diagram Pdf
You may download the Data Flow Diagram for Loan Management System PDF by clicking the button below. It has the full details and discussion of the System’s Data Flow Diagram. You can also modify its content to complete your project requirements and needs.
Data Flow Diagram Notations:
To define the data flow diagram, we used DFD notations. They were presented in symbols to be understood easily. The symbols present the following:
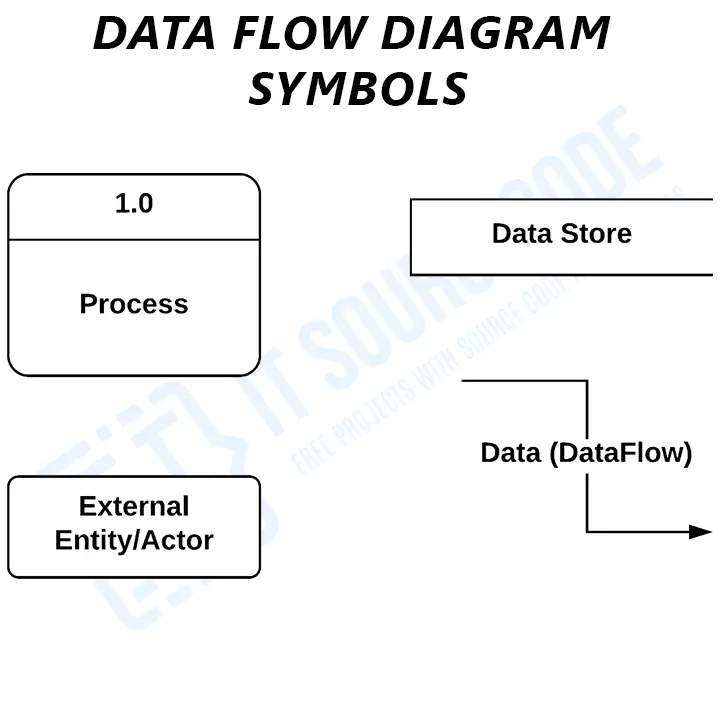
- External Entity: provides or receives information and communicates with the system. They are the origins and destinations of data entering and exiting the system. Entities could also be a third-party company or individual, a computer system, or a business system. The terms used for entities are terminators, sources, sinks, and actors.
- Process: is the part of DFD that modifies data and generates an output. It also executes calculations, sorts data according to logic, or directs data flow according to business standards.
- Data Store: A database table or a membership form are examples of files or repositories that store information for later use. Also, this part requires proper labeling.
- Data Flow: is the path that the data takes between external entities, processes, and data repositories. It depicts the interface between the other components. Also, a labeled arrow is used to present data flow.
These data flow diagram notations represent the total data handling. Using these Data Flow Diagram symbols would also help to draw attention to the system’s architecture in a simpler way.
How to Create Data Flow Diagram?
Time needed: 5 minutes
Here’s the simplest way to create your DFD diagram for Loan Management System.
- Step 1: Familiarize Data Flow Diagram (DFD) Symbols
Data flow diagrams show how information moves through a system or process. Along with data repositories and users, it also includes data inputs and outputs. Before you construct the actual diagram, you must be familiar with its symbols and applications.
- Step 2: Analyze the processes and data included
Analyzation is very important in creating a data flow diagram. It also helps in understanding the meaning of the diagram and avoiding unwanted errors.
The gathered information from the users is very useful in creating the diagram. You also need to evaluate the data and choose the general processes.
From the general processes, you will see the possible data that will enter and exit the system. However, only user data and processes related to the loan management process are included. - Step 3: Plot the Data Flow Diagram
To plot the data flow diagram, you will need the users, processes, databases, and data flows. Then you’ll base the data flow on the evaluated information to have a detailed data flow diagram.
First, you need to identify the users involved and the main processes they will perform. This will first generate the DFD Level 0, or the context Diagram.
Then you will deepen the idea in DFD Level 0. To perform this, you must figure out the sub-processes that complete the main process. You will also add a data store that will serve as storage for the processed data.
After that, you will trace the flow or path of data to know the transformations of data inputs into outputs. This will create the DFD Level 1.
Lastly, DFD is done by adding the supporting processes in DFD Level 1. You will connect them to the existing level to give more elaboration to the data flow diagram.
Conclusion
In conclusion, we have discussed the things that we need to know to create a data flow diagram. Its main purpose is to emphasize the transformation of data from input to output. Along with this, DFD levels were very useful in elaborating the system.
Further, the information was appropriately categorized. It highlights the loan management system’s organizational structure. This documentation will not only help with the foundation of the project but also with its behavior. Check out these related articles for more!
Related Articles:
- Doctor Appointment System DFD
- DFD for Login and Registration
- DFD for Hotel Reservation System
- Railway Reservation System DFD
- DFD Diagram for ATM System
- Purchase Management System DFD
Inquiries
If you have inquiries or suggestions about DFD Diagram for Loan Management System, just leave us your comments below. We would be glad to hear to concerns and suggestions and be part of your learning.
Keep us updated and Good day!
Hello,
Good post. It’s always helpful to read through an article, your article provides such great information with good knowledge that surely can enrich my knowledge. the topic here I found was really effective
A loan management system is a digital platform that helps automate every stage of the loan lifecycle, from application to closing. The traditional loan management process is meticulous, and time-consuming, and requires collecting and verifying information about applicants, their trustworthiness, and their credibility.
If you want to read about more benefits of the loan management system. I read through an article and I think it will be helpful for your visitors. I want to share with you check out-