
Cordora Trading and Services System Document – Chapter 3
This Cordora Trading and Services System Document – Chapter 3 discussed about the research methodology on how the system developed by gathering information to serve as the foundation of the system, the discussion about data analysis for the proposed system. The methodology was probably needed in any system as it served as a basis for the development of the project. It also worked as a guide in following the step-by-step method.
SYSTEM DEVELOPMENT LIFE CYCLE (SDLC)
The Software Development Life Cycle (SDLC) is a framework defining tasks performed at each step in the software development process. It is a structure followed by a development team with in the software organization. It consists of a detailed plan describing how to develop, maintain and replace the specific software.
The life cycle defines the methodology for improving the quality of the software and over all development process. The proponents will use the Rational Unified Process Methodology as a guide of processing the system flow.
EXTREME PROGRAMMING METHODOLOGY
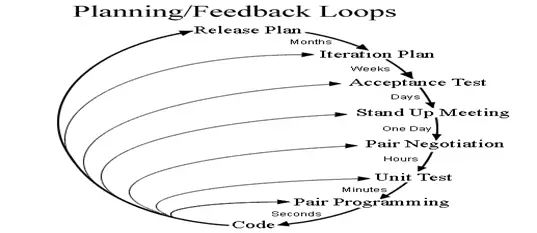
Figure 1. Extreme Programming Methodology
Figure 1. Shows the Extreme Programming Diagram used by the proponents as their model for the system. It shows how the research and process is being implemented from the start of the process until it has been finished. Extreme programming (XP) is a software development methodology which is intended to improve software quality and responsiveness to changing customer requirements.
As a type of agile software development, it advocates frequent “releases” in short development cycles, which is intended to improve productivity and introduce checkpoints at which new customer requirements can be adopted.
Other elements of extreme programming include: programming in pairs or doing extensive code review, unit testing of all code, avoiding programming of features until they are actually needed, a flat management structure, code simplicity and clarity, expecting changes in the customer’s requirements as time passes and the problem is better understood, and frequent communication with the customer and among programmers.
Release Plan
In this phase, the proponents meet and creates a release plan, which lays out the overall project of CORDORA TRADING AND SERVICES MANAGEMENT SYSTEM. Then used to create iteration plans for each individual iteration.
Iteration Plan
The proponents meet at the beginning of each iteration to produce that iteration’s plan of programming tasks. Each iteration is 1 to 3 weeks long. User stories are chosen for this iteration by the customer from the release plan in order of the most valuable to the customer first.
Acceptance Test
The proponents meet with the customer, and the customer specifies scenarios to test when a user story has been correctly implemented. A story can have one or many acceptance tests, whatever it takes to ensure the functionality works.
Stand Up Meeting
The proponents meet, most of proponents do not contribute, but attend just to hear the outcome of every works, and what problems are causing delays.
Pair Negotiation
The Proponents combine two sets of skills for design and implementation to yield the best solution.
Unit Test
The Proponents first create or download a unit test framework to be able to create automated unit tests suites. Second Proponents should test all classes in the system. Trivial getter and setter methods are usually omitted. Proponents will also create their test first, before the code.
Pair Programming
The proponents select two skilled people in programming, this two programmers work side-by-side at one computer, continuously collaborating on the same design, algorithm, code, or test.
Cordora Trading and Services System Document – Chapter 3:Use Case Model
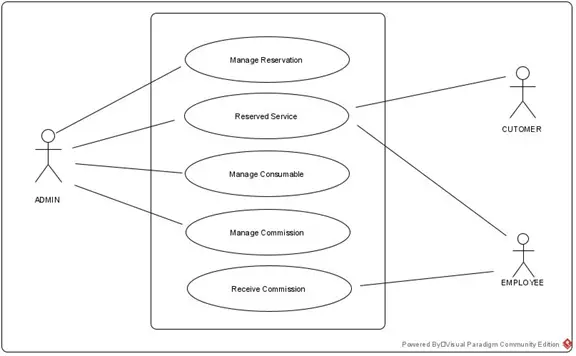
Figure 2. Cordora Trading and Services System Use Case Diagram
Figure 2: Describing the process of how the admin manage the reservation of the customer and consumable equipment that needed for the service. Admin will track the salary of employees based on their service done. To ensure that the salary of employees pay in proper amount
MANAGE RESERVATION
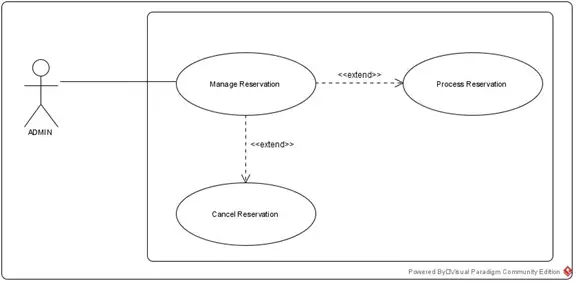
Figure3. Manage Reservation Use Case Diagram
Figure 3: This figure show how the admin manage the reservation
Table 2. Manage Reservation Use Case Description
| Use Case Name: | Manage Reservation | |
| Actors: | Admin | |
| Description: | This use case describes how the Admin manages the reservation by creating new reservation and modifying existing ones. | |
| Pre-conditions: | Admin is logged into System | |
| Post-conditions: | Costumer has received an acknowledgement from the system that the transaction was successful or if not complete, a message explaining the failure | |
| Normal Flow: | Actor | System |
| Costumer selects servicesCostumer input and submit informationAdmin view reservation if reservation is availableAdmin contact the costumerAdmin confirm reservation | System invokes Create New Services and display form 2.1 System validates services information 2.2 System creates a new service entry and sends an acknowledgment back to the Admin System validates service information | |
| Alternative Flows: | Service information validation failed, display an error message, and go to step 2Service validation failed, display an error message, and go to step 4 | |
| Business Rules: | Service validation script/code conditions |
RESERVE SERVICE
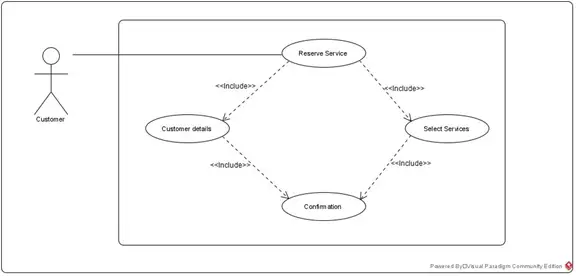
This figure show how the customer reserve the service
Figure 4. Reserved Service Use Case Diagram
Figure 4: This reserved service use case diagram shows the flow of customer transaction
Table 3. Manage Reserved Service Use Case Description
| Use Case Name: | Reserved Service | |
| Actors: | Costumer | |
| Description: | This use case describes how Costumer process a service reservation | |
| Pre-conditions: | Customer need to submit their information | |
| Post-conditions: | admin has received an acknowledgement from the system that there was a new reservation | |
| Normal Flow: | Actor | System |
| Costumer selects servicesCostumer submit information Costumer set job date startedCostumer select employeeAdmin confirm reserved service | 1.1 System invokes Create New Services and display form System validates customer information 3.1 System validate if date available 4.1 System validate if employee available | |
| Alternative Flows: | Service information validation failed, display an error message, and go to step 2Service validation failed, display an error message, and go to step 4 | |
| Business Rules: | Service validation script/code conditions |
MANAGE CONSUMABLE
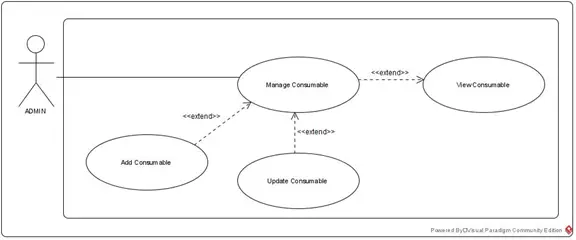
This figure show how the admin manage the consumable
Figure 5. Manage Consumable Use Case Diagram
Figure 5: This manage consumable use case diagram shows how admin manage the usable equipment.
Table 4. Manage Consumable Use Case Description
| Use Case Name: | Manage Consumable | |
| Actors: | Admin | |
| Description: | This use case describes how the Admin manages the Consumables | |
| Pre-conditions: | Admin is logged into System | |
| Post-conditions: | Admin has received an acknowledgement from the system that the Consumable was successful or if not complete, a message explaining the failure | |
| Normal Flow: | Actor | System |
| Admin View ConsumableAdmin Manage ConsumableAdmin can CRUD Admin Enable or Disable Consumable | System show the list of Consumable 2.1 System perform the instruction of admin 3.1 System show Confirmation of CRUD | |
| Alternative Flows: | Service information validation failed, display an error message, and go to step 2Service validation failed, display an error message, and go to step 4 | |
| Business Rules: | Service validation script/code conditions |
MANAGE COMMISSION
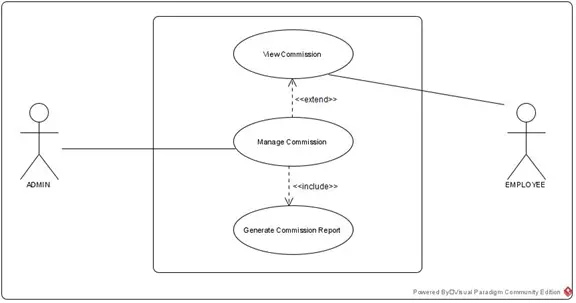
This figure show how the admin manage the commission of employee
Figure 6. Manage Commission Use Case Diagram
Figure 6: This manage commission use case diagram shows how admin and employee transaction.
Table 5. Manage Commission Use Case Description
| Use Case Name: | Manage Commission Information | |
| Actors: | Employee/Admin | |
| Description: | This use case describes how the Employee and Admin manages the commission | |
| Pre-conditions: | Admin log in into System | |
| Post-conditions: | Admin has received an acknowledgement from the system that the transaction was successful or if not complete, a message explaining the failure | |
| Normal Flow: | Actor | System |
| 1.Employee view payroll 2.Admin will check the record of employee based on their service done | 1.1 System show the record of employee based on their service done 2.1 System compute the commission of the employee based on their service done | |
| Alternative Flows: | Service information validation failed, display an error message, and go to step 2 Service validation failed, display an error message, and go to step 4 | |
| Business Rules: | Service validation script/code conditions |
Activity Diagram for Cordora Trading and Services System Document – Chapter 3
RESERVATION
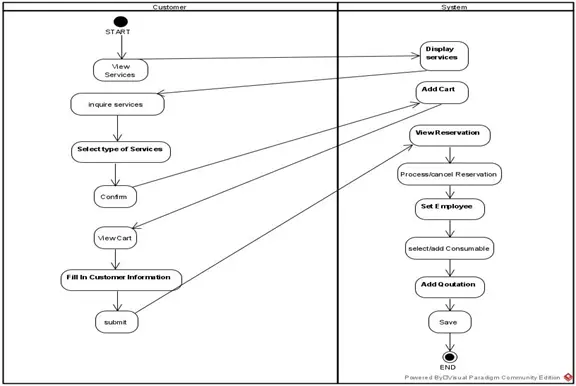
Figure 7. Reservation Activity Diagram
Figure 7: The reservation activity diagram shows that the customer views the service he/she wants, inquire services, select type of service, fill in customer, information. The system on this activity displays the list of services, view reservation and set the employee. Lastly, the admin will confirm the reserved service.
Context Diagram for Cordora Trading and Services System Document – Chapter 3
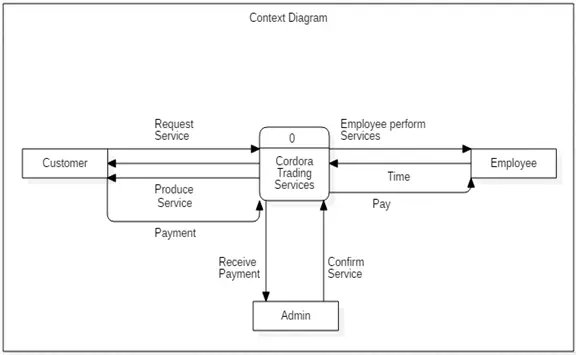
Figure 8. Context Diagram of Cordora Trading and Services Management System
Figure 8: The context diagram of Cordora Trading and Services Management System displays the flow of the system throughout the system process. It shows input information where the data goes and how it is stored.
Dataflow Diagram for Cordora Trading and Services System Document
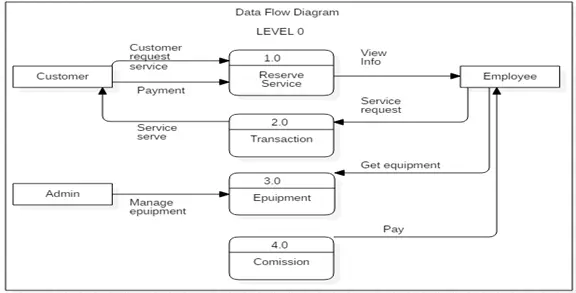
Figure 9. Data Flow Diagram of Cordora Trading and Services Management System Level 0
Figure 9: Data flow diagram proposed concept and flows of solution in each entity that shows all the process in proposed identity where the process begins.
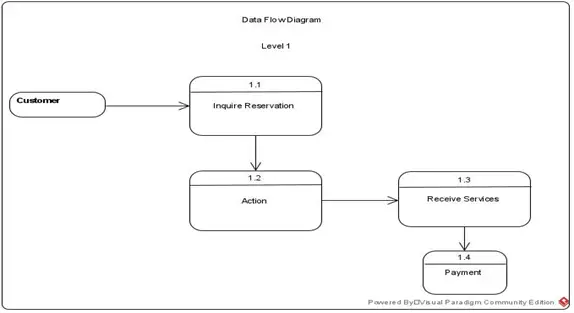
Figure 10. Data Flow Diagram of Customer Level 1
Figure 10: The data flow diagram of customer shows the flow of customer transaction.
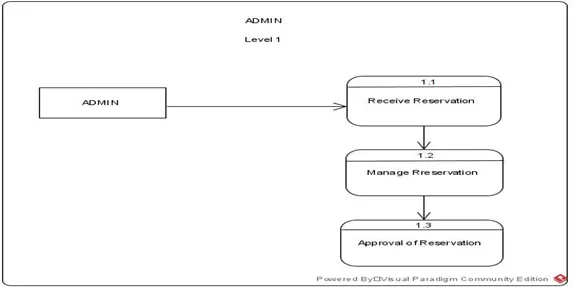
Figure 11. Data Flow Diagram of Admin Level 1
Figure 11: The data flow diagram of admin shows the flow how admin manage the reservation of customer.
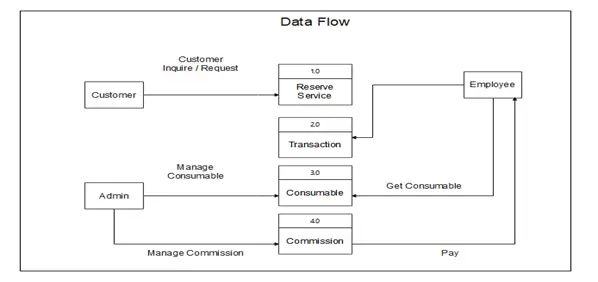
Figure 12. Data Flow Diagram of Customer Level 1
Figure 12: The data flow diagram of customer shows the flow how the customer and admin transaction process.
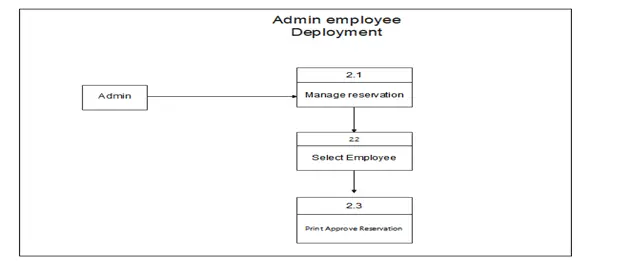
Figure 13. Data Flow Diagram of Admin Employee Deployment Level 1
Figure 13: The data flow diagram of admin employee deployment shows how the admin deploy their employee.
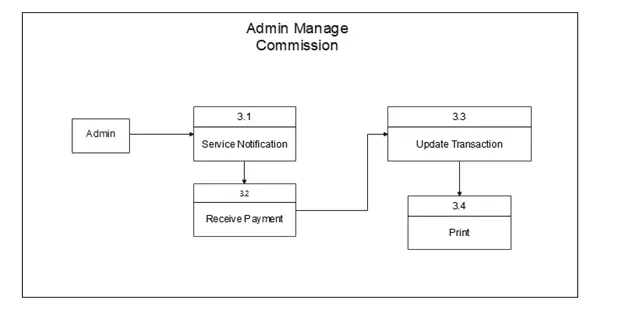
Figure 14. Data Flow Diagram of Admin Manage Commission Level 1
Figure 14: The data flow diagram of admin manage commission shows how the admin manage the commission of their employee.
Entity Relationship Diagram for Trading and Services System
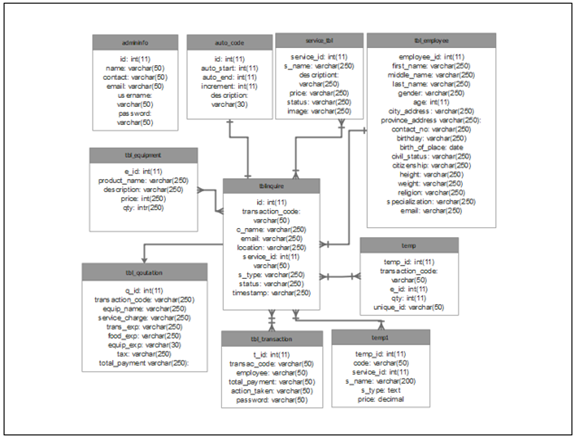
Figure 15. Entity Relationship Diagram of Cordora Trading and Services
Figure 15: The entity relationship diagram shows the list of tables and how the relation of each tables.
Data Dictionaries
These tables below provide the entire database tables details such as Field Name, Descriptions, data types, character lengths.
Table 6. TABLE admininfo
| Field Name | Description | Type | Length |
| id(PK) | Id | Int | 11 |
| Name | Name | Varchar | 50 |
| Contact | Contact | Int | 50 |
| Varchar | 50 | ||
| Username | username | Varchar | 50 |
| Password | password | Varchar | 50 |
This table show the attributes of entity of admininfo
Table 7. TABLE auto_code
| Field Name | Description | Type | Length |
| id (PK) | Id | Int | 11 |
| auto_start | Auto start | Int | 11 |
| auto_end | Auto end | Int | 11 |
| increment | increment | Int | 11 |
| description | Status | Varchar | 11 |
This table show the attributes of entity of auto_code
Table 8. TABLE service_tbl
| Field Name | Description | Type | Length |
| service_id (PK) | Servce id | Int | 11 |
| s_name | Service name | Varchar | 250 |
| description | description | Varchar | 250 |
| Price | Price | Int | 250 |
| Status | Status | Varchar | 250 |
This table show the attributes of entity of service_tbl
Table 9. TABLE tblcategory
| Field Name | Description | Type | Length |
| cat_id(PK) | Category id | Int | 11 |
| service_id | Service id | Int | 250 |
| type_of_services | Type of services | Text | 250 |
| Price | price | Varchar | 250 |
This table show the attributes of entity of tblcategory
Table 10. TABLE tblinquire
| Field Name | Description | Type | Length |
| id (PK) | id | Int | 11 |
| c_name | Customer name | Varchar | 2 50 |
| Varchar | 250 | ||
| Contact | contact | Int | 250 |
| brand_model | Brand model | Varchar | 250 |
| Problem | problem | Varchar | 250 |
| Location | location | Varchar | 250 |
| service_id (FK) | Service id | Int | 11 |
| Status | status | Varchar | 10 |
| timestamp | Date and time | timestamp |
This table show the attributes of entity of tblinquire
Table 11. TABLE tbl_employee
| Field Name | Description | Type | Length |
| employee_id (PK) | Employee Id | Int | 250 |
| first_name | First name | Varchar | 250 |
| middle_name | Middle name | Varchar | 250 |
| last_name | Last name | Varchar | 250 |
| Gender | gender | Varchar | 250 |
| Age | Age | Int | 20 |
| city_address | City address | Varchar | 250 |
| province_address | Province address | Varchar | 250 |
| contact_no | Contact no | Varchar | 20 |
| Birthday | birthday | Date | 250 |
| birth_of_place | Place of Birth | Varchar | 250 |
| civil_status | Civil status | Varchar | 250 |
| citizenship | citizenship | Varchar | 250 |
| Height | height | Varchar | 20 |
| Weight | weight | Varchar | 20 |
| Religion | religion | Varchar | 250 |
| specialization | specialization | Varchar | 250 |
| Varchar | 250 |
This table show the attributes of entity of tbl_employee
Table 12. TABLE tbl_equipment
| Field Name | Description | Type | Length |
| e_id (PK) | Id | Int | 11 |
| product_name | Product name | Varchar | 250 |
| description | description | Varchar | 225 |
| Price | price | Int | 250 |
| Qty | Quantity | Int | 11 |
This table show the attributes of tbl_equipment
Table 13. TABLE tbl_quotation
| Field Name | Description | Type | Length |
| q_id (PK) | Id | Int | 11 |
| transaction_code | Transaction code | Varchar | 200 |
| service_charge | Service charge | Varchar | 225 |
| trans_exp | Transportation expenses | Varchar | 225 |
| food_exp | Food expenses | Varchar | 225 |
| equip_exp | Equipment expenses | Varchar | 30 |
| Tax | tax | Varchar | 225 |
| total_payment | Total payment | Varchar | 225 |
This table show the attributes of entity of tbl_quotation
Table 14. TABLE tbl_transaction
| Field Name | Description | Type | Length |
| T_id (PK) | Id | Int | 11 |
| transac_code | Transaction code | Varchar | 225 |
| Employee | employee | Varchar | 225 |
| total_payment | Total payment | Varchar | 225 |
| action_taken | Action taken | Varchar | 225 |
This table show the attributes of entity of tbl_transaction
Table 15. TABLE temp
| Field Name | Description | Type | Length |
| temp_id (PK) | Id | Int | 11 |
| transaction_code | Transaction code | Varchar | 30 |
| e_id | Equipment Id | Int | 11 |
| Qty | quantity | Int | 11 |
| unique_id | Unique id | Varchar | 30 |
This table show the attributes of entity of temp
Table 16. TABLE temp1
| Field Name | Description | Type | Length |
| Temp1_id (PK) | Id | Int | 11 |
| Code | code | Varchar | 30 |
| service_id | Service id | Int | 11 |
| s_name | Service name | Varchar | 200 |
| s_type | Service type | Text | |
| Price | price | Decimal | 13,2 |
| user_id | User Id | Int | 11 |
This table show the attributes of entity of temp1
System Screen Layout
The screen layout of “Cordora Trading and Services Management System”
Client Side Interface
This picture shows the interface of Client Side Home
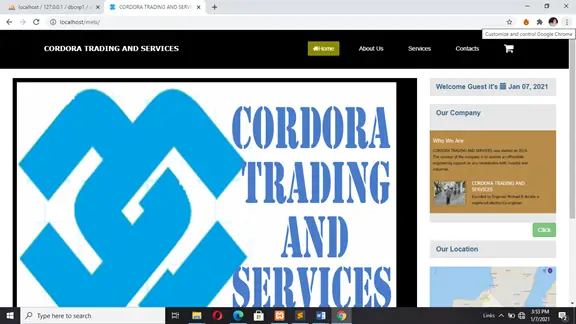
Figure 16. Screen Design for Client Side Home
Figure 16. This picture shows the interface of client side
Services Interface
This picture shows the interface of About Us

Figure 17. Screen Design for About Us
Figure 17. This picture shows the company profile.
Service Interface
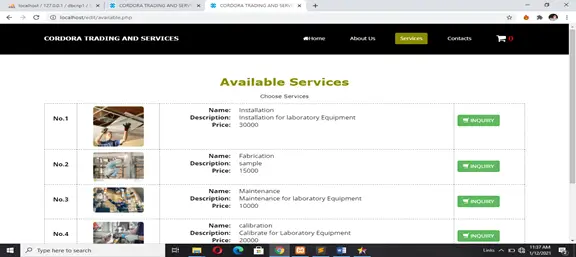
Figure 18. Screen Design for Services
Figure 18. This figure shows the interface of Services.
Contact Interface
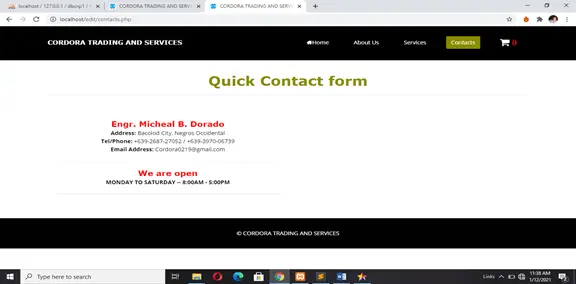
Figure 19. Screen Design for Contact
Figure 19. This picture shows the interface of Contact.
Cart Interface
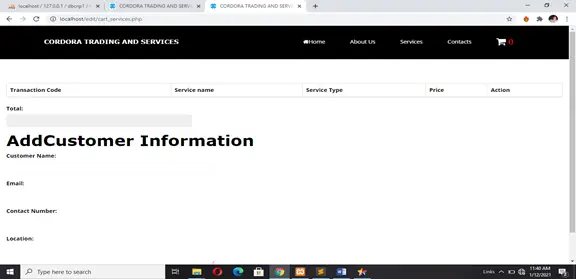
Figure 20. Screen Design for Cart
Figure 20. This picture shows the interface of Cart.
Customer Inquiry Interface
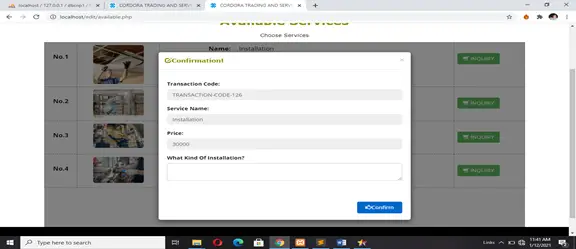
Figure 21. Screen Design for Customer Inquiry
Figure 21. This picture shows the interface of Customer Inquiry.
Admin Side Interface
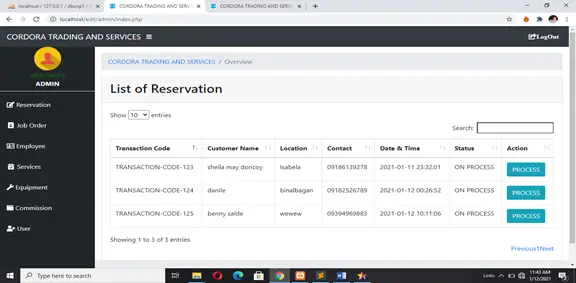
Figure 22. Screen Design for List of Reservation
Figure 22. This picture shows the interface of List of reservation.
Process of Reservation Interface
This picture shows the interface of Process of Reservation
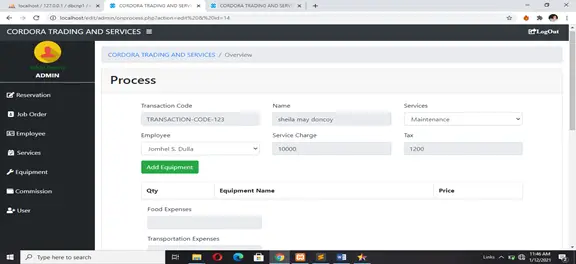
Figure 23. Screen Design for Process of Reservation
Figure 23. This picture shows the interface of Process of Reservation.
List of Transaction Interface
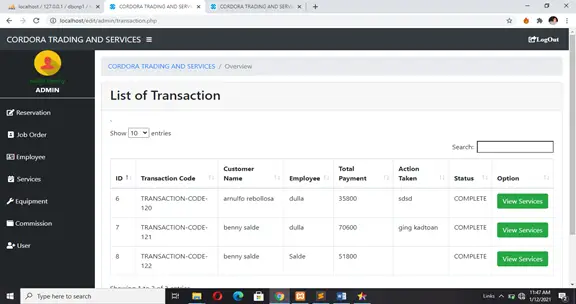
Figure 24. Screen Design for List of Transaction
Figure 24. This picture shows the interface of List of Transaction.
Report Interface
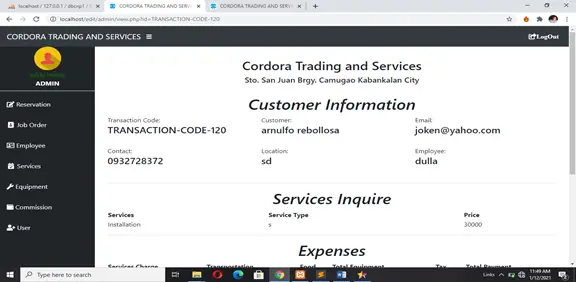
Figure 25. Screen Design for View Services
Figure 25. This picture shows the reports.
List of Employee Interface
This picture shows the interface of List of Employee
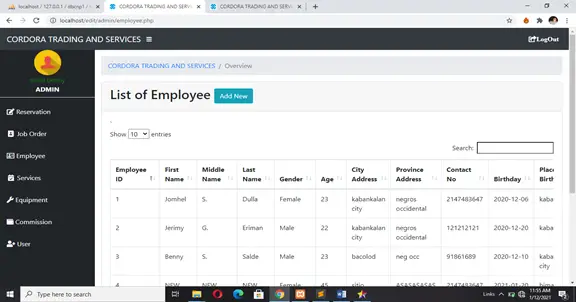
Figure 26. Screen Design for List of Employee
Figure 26. This picture shows the list of employee.
Add Employee Interface
This picture shows the interface of Add Employee
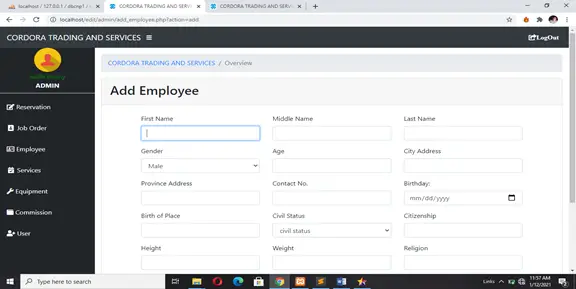
Figure 27. Screen Design for Add Employee
Figure 27. This picture shows the add employee.
Update Employee Interface

This picture shows the interface of Update Employee
Figure 28. Screen Design for Update Employee
Figure 28. This picture shows the update employee.
List of Service Interface
This picture shows the interface of List of Service
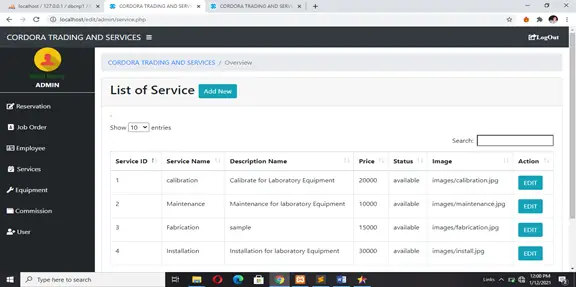
Figure 29. Screen Design for List of Service
Figure 29. This picture shows the service.
Add Service Interface
This picture shows the interface of Add Service
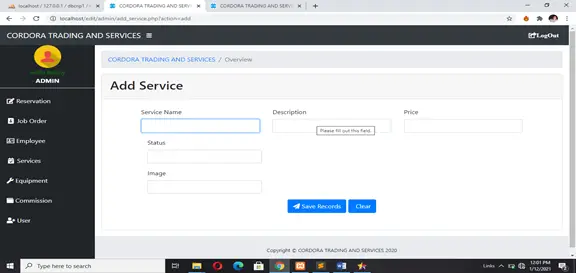
Figure 30. Screen Design for Add Service
Figure 30. This picture shows the add service.
Update Service Interface
This picture shows the interface of Update Service
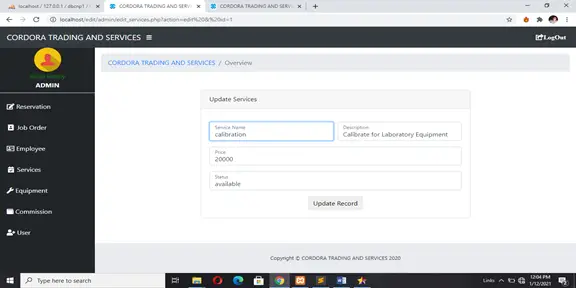
Figure 31. Screen Design for Update Service
Figure 31. This picture shows the update service.
List of Consumable Interface
This picture shows the interface of List of Consumable
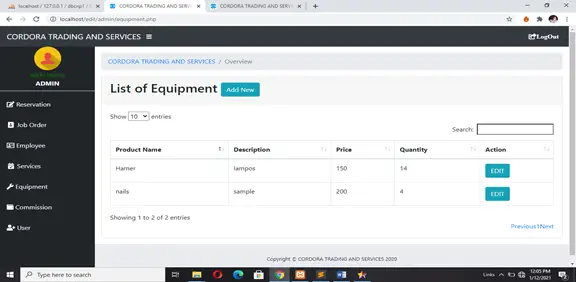
Figure 32. Screen Design for List of Consumable
Figure 32. This picture shows the consumable.
Add Consumable Interface
This picture shows the interface of Add Consumable
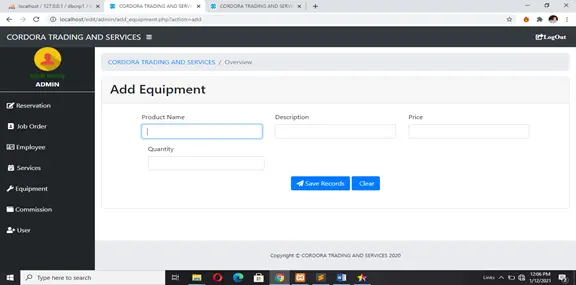
Figure 33. Screen Design for Add Consumable
Figure 33. This picture shows Add Consumable.
Update Consumable Interface
This picture shows the interface of Update Consumable
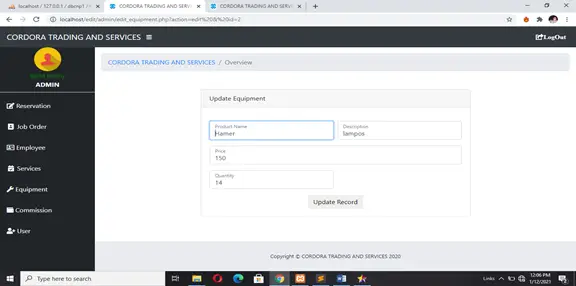
Figure 34. Screen Design for Update Consumable
Figure 34. This picture shows the update consumable.
List of Commission Interface
This picture shows the interface of List of Commission
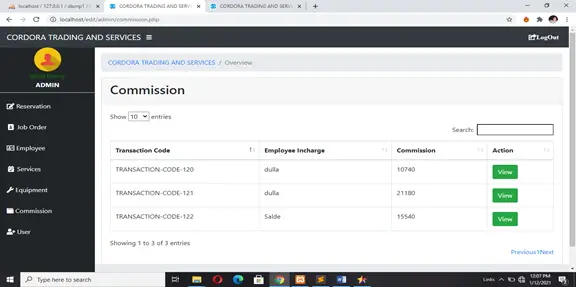
Figure 35. Screen Design for List of Commission
Figure 35. This picture shows the Commission.
List of User Interface
This picture shows the interface of List of User
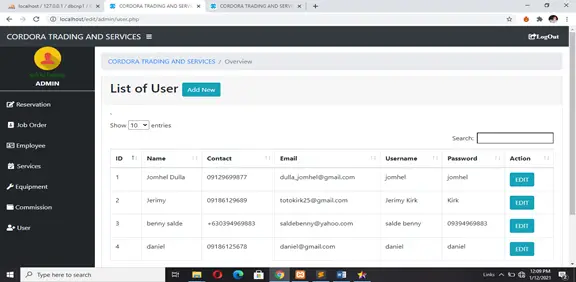
Figure 36. Screen Design for List of User
Figure 36. This picture shows the user.
Architechtural Diagram for Cordora Trading and Services System Document
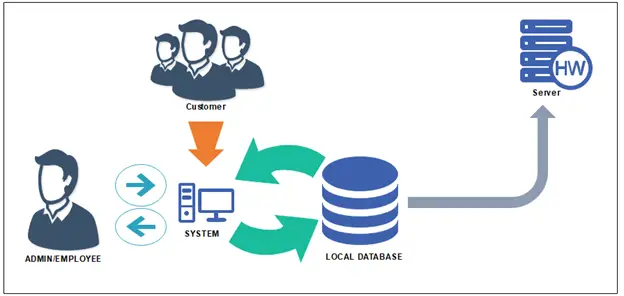
Figure 37. Architectural Diagram
Figure 37. This picture shows the architectural diagram.
Trading and Services System Document : Hardware and Software Requirements
In the development of the system, the developer uses both software and hardware are recommended.
The following Hardware and Software specifications should be considered for the development of the system project.
Development:
Computer Unit Specification
Processor: intel CORE i3 7th Gen
RAM: 4GB
ROM: 1TB
Others: Printer and USB cord
Software Development Specification
Web Base
MYSOL
Gantt Chart
The Gantt Chart assesses the proponents with the project management throughout the whole Process. It caters of how long the process will take that allow time management effectively. The minimum delivery time of this project was being figure out means of Gantt chart.
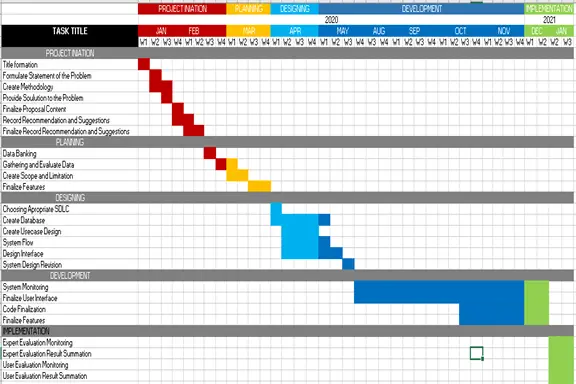
Figure 38. Gantt chart
Figure 38. This picture shows the Gantt chart.
Table 17. Time Table
| Task | Date started | Date finish | Assigned member |
| Project Initiation | 1/1/2020 | 2/7/2020 | The proponents |
| Title Formation | 1/1/2020 | 1/7/2020 | All members |
| Formulate Statement of the Problem | 1/7/2020 | 1/13/2020 | Kirk Eriman |
| Create Methodology | 1/7/2020 | 1/20/2020 | Benny salde |
| Provide Solution to the Problem | 1/13/2020 | 2/20/2020 | Kirk Eriman and Benny salde |
| Finalize Proposals’ Content | 1/20/2020 | 1/27/2020 | Kirk Eriman and Benny salde |
| Record Recommendation and suggestions | 1/27/2020 | 2/3/2020 | Kirk Eriman |
| Finalize Recommendations and Suggestions | 2/3/2020 | 2/10/2020 | Kirk Eriman and Benny salde |
| Planning | 2/10/2020 | 2/17/2020 | Proponents |
| Data Banking | 2/10/2020 | 2/17/2020 | Benny Salde |
| Gather and Evaluate Data | 2/17/2020 | 3/1/2020 | Kirk Eriman |
| Create Scope and Limitation | 3/1/2020 | 3/16/2020 | Kirk Eriman and Benny salde |
| Finalize Features | 3/16/2020 | 3/31/2020 | Kirk Eriman and Benny salde |
| Designing | 4/1/2020 | 4/9/2020 | Proponents |
| Choosing Appropriate SDLC | 4/1/2020 | 4/9/2020 | Kirk Eriman and Benny salde |
| Create Database | 4/1/2020 | 5/1/2020 | Jomhel Dulla |
| Create Use Case Design | 4/7/2020 | 4/30/2020 | Kirk Eriman |
| System Flow | 4/7/2020 | 5/1/2020 | Benny Salde |
| Design Interface | 4/17/2020 | 5/11/2020 | Benny Salde |
| System Design Revision | 5/18/2020 | 5/25/2020 | Kirk Eriman and Benny salde |
| Development | 5/25/2020 | 12/15/2020 | Proponents |
| System Monitoring | 5/25/2020 | 12/15/2020 | Jomhel Dulla |
| Finalize User Interface | 5/25/2020 | 12/15/2020 | Jomhel Dulla |
| Code Finalization | 10/19/2020 | 12/15/2020 | Jomhel Dulla |
| Finalize Features | 10/19/2020 | 12/15/2020 | Jomhel Dulla |
| Testing and Implementation | 1/4/2021 | 1/15/2021 | Proponents |
| Expert Evaluation Monitoring | 1/11/2021 | 1/20/2021 | Daniel Bandiola |
| User Evaluation Monitoring | 1/11/2021 | 1/20/2021 | Daniel Bandiola |
| Expert Evaluation Result Summation | 1/11/2021 | 1/20/2021 | Daniel Bandiola |
| User Evaluation Result Summation | 1/11/2021 | 1/20/2021 | Daniel Bandiola |
Table 17. Shows the series of activities throughout the development of the system and the assigned task that the proponents performed.
Related Article
- Cordora Trading and Services System Document – Chapter 1
- Cordora Trading and Services Project – Chapter 2
- Tools and Equipment Monitoring System Methodology
- Law Firm Document Management System Chapter 3
- CHMSC Binalbagan IT Freshmen Admission System Thesis Chapter 3
- Online Delivery Design and Methodology Documentation Chapter 3
- Enrollment System Thesis Documentation Chapter 3
- Library Borrowing System Documentation | Chapter III – Methodology
- Sales and Inventory System Thesis PDF Chapter 3
- Order Management System Thesis Chapter 3 | Methodology
Inquiries
If you have any questions or suggestions about Cordora Trading and Services System Document – Chapter 3, please let me know by dropping your comment below.